📊 Full opportunity report: Building an AI Trading Bot — Week One: Why a 90 % Win Rate Can Still Lose Money on ThorstenMeyerAI.com — validation score, market gap, and execution plan.

TL;DR

An experimental AI trading bot tested on simulated markets shows that high win rates alone do not indicate profitability. One promising strategy hints at genuine edge, but results are preliminary and context-dependent.

A researcher testing an AI-driven trading bot in simulated short-term markets reports that a high win rate does not necessarily translate into profitability. The findings challenge common assumptions and underscore the importance of understanding market pricing and trade asymmetries.

The experiment involves running 21 strategy variants across multiple assets in a simulated environment, with some strategies achieving over 90% win rates. However, these high win rates are often due to taking late-stage bets when the market has already heavily favored one outcome, which skews the perception of edge.

When adjusting for the market’s implied probabilities—rather than naive 50% assumptions—the apparent advantage of many strategies diminishes or reverses. For instance, strategies showing 98% wins on one asset are actually slightly negative when considering the market’s own pricing, highlighting that winning more than half the time is not enough if the wins are small and the losses are large.

Among the strategies tested, one approach—using a fair-value model on a liquid asset—has shown a consistent, modest profit despite a win rate below 50%. Its larger average wins relative to losses suggest genuine predictive edge, but the sample size remains too small to confirm this with certainty.

Building an AI Trading Bot · Week One · The Win Rate Trap.
DISPATCH / PAPER TRADING RESEARCH AI TRADING BOT · WEEK ONE · WIN RATE TRAP · SIMULATED FUNDS
▲ NOT FINANCIAL ADVICE Paper trading · simulated funds only · research lab
Building an AI Trading Bot · Part 1 of an ongoing series

Week one.
Why a 90% win rate
can still lose money.

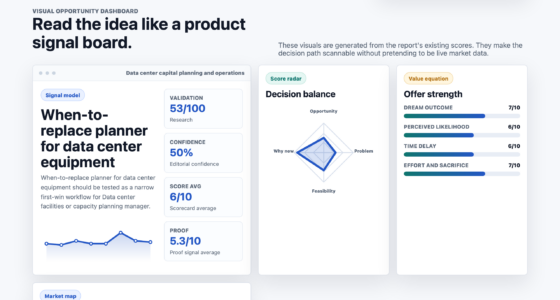
21 strategies running in parallel · 700+ settled paper trades · 18 of 21 with reasonable win rates · 2 variants at 100% wins. And almost none of it means what it looks like.

An experimental AI-driven trading bot running 21 strategy variants against 5-minute binary prediction markets on major crypto assets. Every trade is paper — simulated funds only. Headline numbers look extraordinary: 18 of 21 variants with reasonable win rates · entire fleet on one underlying with >90% wins · two specific variants at 100% wins over 38-44 settled trades. The data is telling a very different story than the leaderboard suggests. Most of the "winning" strategies are buying when the market has already priced one side at 90-95 cents on the dollar — the right baseline isn't 50%, it's the market-implied probability, and below 95% wins on that math is a slow bleed. One strategy — and only one — has the opposite signature: below-50% win rate, 2.5× average winning trade vs losing trade, meaningfully positive net P&L over several hundred settled positions. The right signature. The smoking-gun negative result: same code running on different assets is statistically significantly losing money. Same model, same parameters, different markets, different results — that's data you'd pay for.

!
▲ Not financial advice · simulated funds only · research lab
The bot described here trades exclusively with simulated money. Nothing in this article should be used to inform real trading decisions. If you build something similar and run it with real funds, you should fully expect to lose them — that is the most likely outcome, by a wide margin, regardless of what early numbers suggest. Prediction markets are zero-sum after fees, dominated by sophisticated participants, and structurally hostile to part-time retail strategies.
▲ The structural editorial finding · week one
Win rate is the wrong metric. P&L distribution and expected value are everything. A 95%-win strategy that loses 19× as much when it's wrong is a worse trade than a 45%-win strategy that pays 2× as much when it's right. The right null hypothesis is not "random" — it's "whatever the market is already pricing." A strategy that works equally well on everything is almost always a fluke; a strategy that works narrowly is doing something.
— building an ai trading bot · week one · the win rate trap · paper trading research lab
21
Strategy variants running in parallel · 4 strategy families × 4 underlyings · each on its own simulated bankroll
Real market data · real order books · real fees · real latency model · simulated funds only · research lab not wallet
700+
Settled paper trades across the fleet · enough to reject "obviously useless" · nowhere near enough to claim "real edge"
18 of 21 variants showing reasonable win rates · entire fleet on one underlying at >90% wins · 2 at 100% over 38-44 trades
1
Strategy with the right edge signature · <50% win rate · 2.5× win:loss ratio · meaningfully positive net P&L
Fair-value style model on most liquid underlying · candidate worth watching · sample still too small to call
99%
Confidence on cross-asset negative result · same code statistically significantly losing money on other underlyings
Same model · same parameters · same code path · different volatility regime + microstructure · different result · informative
90% WIN RATE TRAP SNIPER-STYLE VARIANTS · 19× LOSSES VS WINS · NET NEGATIVE P&L · MECHANICAL ILLUSION BASELINE IS NOT 50% MARKET-IMPLIED PROBABILITY IS THE RIGHT NULL · 95% PRICED IN = 95% NEEDED TO BREAK EVEN CANDIDATE SIGNATURE <50% WINS · 2.5× WIN:LOSS · MEANINGFULLY POSITIVE · ORDER OF MAGNITUDE MORE TRADES NEEDED CROSS-ASSET NEGATIVE SAME CODE, DIFFERENT MARKETS, DIFFERENT RESULTS · 99% CONFIDENCE NEGATIVE-EDGE ON ONE VARIANT RUN-TO-ZERO DRAWDOWN GATES DISABLED AS TEACHING EXERCISE · $300 BANKROLL EVAPORATED · INFORMATIVELY MOST STRATEGIES ARE FLAT-TO-LOSING · 1 OF 21 WORTH MORE INVESTIGATION · REST ARE ILLUSIONS, LOSERS, OR NOISE
The 90% win rate trap · asymmetric P&L · the math

90% wins. Still net negative.

Most of the "winning" strategies in the fleet are buying when the market has already decided one side is going to win. They wait until one outcome is priced around 90-95 cents on the dollar, then take the favorite. If the favorite holds, the trade pays a few cents. If it doesn't, the trade loses almost the entire bet. The asymmetry makes the high win rate structurally meaningless.

The asymmetric-P&L math · 90% wins ≠ profit
The 10 winning trades pay a few cents each. The 1 losing trade loses almost the entire bet. The right question is not "do you win more than half the time?" — it's "do you win at the rate the market is already pricing in?"
▲ Sniper-style variant · 90% wins
Mechanical illusion
10 trades × +$0.05 = +$0.50 won
1 trade × −$0.95 = −$0.95 lost
−$0.45 net11 trades · 90.9% win rate · negative P&L
▲ Candidate signature · <50% wins
Real edge
4 trades × +$2.50 = +$10.00 won
6 trades × −$1.00 = −$6.00 lost
+$4.00 net10 trades · 40% win rate · positive P&L
▲ The right baseline · market-implied probability, not coin-flip
If the market is pricing the favorite at 95% to win, you need to win at least 95% of those trades just to break even after the asymmetric payoff. Anything less than 95% is a slow bleed, regardless of how confident the percentages look. A high win rate, by itself, tells you almost nothing about whether a strategy has edge — it tells you about the kind of trades being taken, not the quality of the decisions.
The candidate signature · what real edge looks like
Python for Algorithmic Trading Cookbook: Recipes for designing, building, and deploying algorithmic trading strategies with Python

Python for Algorithmic Trading Cookbook: Recipes for designing, building, and deploying algorithmic trading strategies with Python

As an affiliate, we earn on qualifying purchases.

As an affiliate, we earn on qualifying purchases.

One candidate. Right signature.

After dismissing the high-win-rate experiments as mechanical illusions, the search shifted to the opposite signature — a strategy that loses more often than it wins but still makes money. That's the mathematical fingerprint of a real prediction signal: bigger wins than losses, willing to be wrong frequently in service of being right with conviction.

The candidate signature · <50% wins, 2.5× win:loss, net positive
Fair-value style model on the most liquid underlying. One strategy in the fleet — and currently only one — looks like a real edge signature. Sample still too small to call. Running for at least an order of magnitude more trades before claiming more than "candidate worth watching."
▲ Win rate
<50%
Wrong more often than right. Willing to lose frequently in service of being right with conviction — the mathematical fingerprint of real edge.
▲ Win:loss ratio
2.5×
Average winning trade is roughly 2.5× average losing trade. Asymmetric P&L on the right side — bigger wins than losses produces positive expected value at <50% accuracy.
▲ Net P&L
+
Meaningfully positive over several hundred settled positions. Fair-value style model not momentum/favorite-rider · most liquid underlying · the right edge signature.
▲ The caveat · sample still too small to call
A few hundred settled trades is enough to reject "obviously useless" — it is nowhere near enough to confidently claim "this is real edge that will persist." A favorable variance window of the right length can produce numbers that look exactly like this without any underlying skill at all. Running for at least an order of magnitude more trades before claiming more than "this is the candidate worth watching."
Cross-asset negative result · the smoking gun
AI Crypto Trading Bot: Build AI-Powered Crypto Trading Systems With Binance, Bybit & 24/7 Automation (AI Trading Systems Series Book 2)

AI Crypto Trading Bot: Build AI-Powered Crypto Trading Systems With Binance, Bybit & 24/7 Automation (AI Trading Systems Series Book 2)

As an affiliate, we earn on qualifying purchases.

As an affiliate, we earn on qualifying purchases.

Same code. Different markets.

The strongest evidence that the candidate strategy might be real comes from an unexpected place: running the exact same code on different assets produces statistically significant losses. Same model, same parameters, same code path, different volatility regime, different microstructure, different result.

Cross-asset negative result · same model, different outcomes
A strategy that works equally well on everything is almost always a fluke. A strategy that works on one specific market structure and fails on others is doing something. The cross-asset variants ran themselves down toward zero, generating clean evidence the underlying model is not universal.
▲ Underlying 1
Most liquid
+ Positive
Meaningfully positive net P&L. Candidate signature. <50% wins · 2.5× win:loss · several hundred trades.
▲ Underlying 2
Cross-asset
− Negative
Statistically significantly losing. Same model · same parameters · different volatility regime.
▲ Underlying 3
Cross-asset
− Negative
99% confidence negative-edge. Same code path · different microstructure · ran itself down toward zero.
▲ Underlying 4
Cross-asset
− Negative
Bankroll evaporated. Risk gates disabled as teaching exercise · $300 simulated bankroll · informatively.
▲ The structural finding · informative in a way "everything's green" never is
The cross-asset variants ran themselves down toward zero, generating clean evidence the underlying model is not universal — that's data you'd pay for. Instead it came from a $300 simulated bankroll evaporating in an interesting way. The negative result is the structural evidence that the candidate strategy might be doing something real — narrow applicability is a feature, not a bug.
Week one lessons · plain language · five bullets
AI + Prediction Markets: The New Edge: How to Use Artificial Intelligence Tools to Research, Scan, and Win in Prediction Markets (Markets Intelligence Series)

AI + Prediction Markets: The New Edge: How to Use Artificial Intelligence Tools to Research, Scan, and Win in Prediction Markets (Markets Intelligence Series)

As an affiliate, we earn on qualifying purchases.

As an affiliate, we earn on qualifying purchases.

Five lessons. Plain language.

What week one actually taught. The lessons are not novel to anyone who has spent serious time on systematic trading — but you don't internalize them until you watch them happen on your own paper bankroll. Out of 21 variants, one candidate worth more investigation. The ratio is roughly what was expected going in.

Five lessons crystallized · the week one observation set
Most strategies will be flat-to-losing. 1 of 21 candidate worth more investigation · the rest are either mechanical illusions, statistically-confirmed losers, or too noisy to tell apart from random. That ratio is roughly what was expected going in.
01
Win rate is the wrong metric. P&L distribution and expected value are everything. A 95%-win strategy that loses 19× as much when it's wrong is a worse trade than a 45%-win strategy that pays 2× as much when it's right.
02
The right null hypothesis is not "random." It's "whatever the market is already pricing." If your strategy isn't beating that, you don't have an edge — you have a confusing way to copy the consensus.
03
Run the same strategy on multiple markets before believing it works. If it falls apart when you change the underlying, it might be real and narrowly applicable. If it works on everything, it's almost certainly variance.
04
Disable risk gates only as a teaching exercise. Several experiments hit their drawdown limits, gates were loosened, they tripped again, gates were disabled entirely, they ran to zero. That run-to-zero was extremely informative. Doing the same thing with real money would have been a disaster.
05
Most strategies will be flat-to-losing. Out of 21 variants, 1 candidate worth more investigation. The rest are illusions, statistically-confirmed losers, or too noisy to tell apart from random. That ratio is roughly what was expected going in — but you don't internalize it until you watch it happen.

Win rate lies. Sample sizes lie. Most things that look like alpha are not. A high win rate, by itself, tells you almost nothing about whether a strategy has edge — it tells you about the kind of trades being taken, not the quality of the decisions. One strategy in the fleet has the right signature — <50% wins, 2.5× win:loss, meaningfully positive net P&L on the most liquid underlying. That's the candidate worth watching. Same code on different markets produces statistically significant losses — informative in a way "everything's green" never is. If you take this article as a reason to put money into anything, you have misread it.

— building an ai trading bot · week one · paper trading research · part 1 of an ongoing series · simulated funds only
The research lab · what's being measured
  • Underlying markets · 5-minute "Up or Down" binary prediction markets on major crypto assets
  • Strategy fleet · 21 variants in parallel · 4 strategy families × 4 underlyings
  • Bankroll model · each variant on its own simulated bankroll · isolated from the rest
  • Simulation fidelity · real market data · real order books · real fees · real latency model · simulated funds only
  • Sample size · 700+ settled trades across the fleet as of week one
  • Headline trap · 18 of 21 showing reasonable win rates · entire fleet on one underlying at >90% · 2 at 100% over 38-44 trades
  • Honest read · most of the "high win rate" variants are below the market's own implied 95% rate · slow bleed
  • Aggregate 16 sniper variants · net negative P&L despite 90% wins · 10% of losses are 19× the size of the wins
  • Candidate signature · <50% wins · 2.5× win:loss · positive net P&L · most liquid underlying · fair-value style
  • Sample caveat · several hundred trades enough to reject "useless" · nowhere near "real edge that will persist"
  • Cross-asset finding · same code statistically significantly losing on other underlyings · 99% confidence on one variant
  • Smoking-gun negative · strategy that works equally on everything = fluke · works narrowly = doing something
  • Run-to-zero · risk gates disabled as teaching exercise · $300 simulated bankroll evaporated · informative
  • Lesson 1 · win rate is the wrong metric · P&L distribution and expected value are everything
  • Lesson 2 · right null hypothesis is market-implied probability · not coin-flip
  • Lesson 3 · run same strategy on multiple markets before believing it works
  • Lesson 4 · disable risk gates only as teaching exercise · never with real money
  • Lesson 5 · most strategies will be flat-to-losing · 1 of 21 candidate worth more investigation
  • What's next · week 2 longer-horizon results on candidate · 100% win rate trap deep-dive · cross-asset and cross-regime analysis · replay testing
  • Trade secrets · cookbook stays out · findings come out · broadcasting the recipe would make whatever edge exists evaporate the moment anyone copied it
Colophon · AI trading bot series · Part 1 · week one

Set in Source Serif 4 (display), EB Garamond (essay body), IBM Plex Sans & IBM Plex Mono. AI Trading Bot research lab · Part 1 of an ongoing series · paper trading only · simulated funds only · the win-rate trap and what real edge actually looks like. Empirical-clay dominant register · labor-rose for the cautionary findings (trap, run-to-zero) · alternative-sage for the candidate-strategy positive signal · structural-slate for the statistical-rigor cross-asset negative result · transition-bronze for the week-one lessons forward horizon. Free to embed with attribution.

thorstenmeyerai.com

AI Trading Bot · Week 1 · The Win Rate Trap · paper trading research

21 STRATEGIES · 700+ TRADES · 1 CANDIDATE · 4 ASSETS · 5 LESSONS · NOT FINANCIAL ADVICE

Excel Data Analysis For Dummies (For Dummies (Computer/Tech))

Excel Data Analysis For Dummies (For Dummies (Computer/Tech))

As an affiliate, we earn on qualifying purchases.

As an affiliate, we earn on qualifying purchases.

Implications of Win Rate vs. Actual Trading Edge

The findings emphasize that a high win rate alone is not an indicator of profitable strategy development. Many strategies appear successful because they exploit market conditions where the odds are heavily skewed, not because they have genuine predictive skill. Recognizing the difference is critical for developing sustainable trading systems and avoiding false signals.

The only promising approach identified so far relies on a model that accepts frequent losses but aims for larger, more profitable wins. This aligns with the core principle that real edge involves asymmetric payoffs, not just frequent small wins. However, the limited data means this conclusion remains provisional.

Market Dynamics and the Pitfalls of Win Rate Metrics

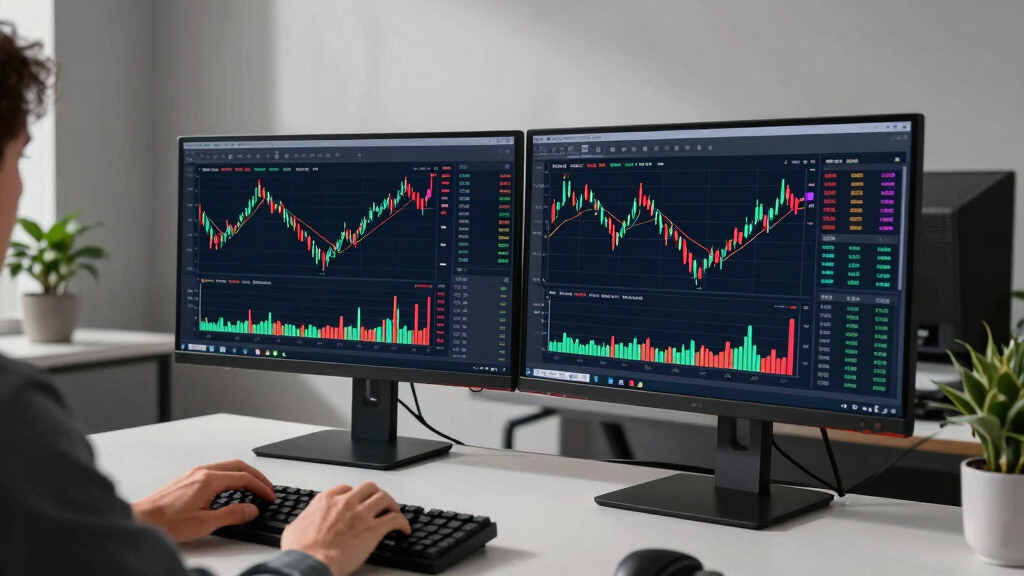
The experiment is set against the backdrop of short-term binary prediction markets for crypto assets, where rapid trades and high volatility create complex microstructure conditions. Prior to this, many traders and algorithms have relied on high win rates as a proxy for success, often overlooking the importance of trade size and market pricing.

This testing builds on ongoing research into AI-based trading systems, emphasizing that understanding market-implied probabilities is crucial. The experiment also highlights the risk of overfitting or mistaking luck for skill, especially in small samples.

"A high win rate, by itself, tells you almost nothing about whether a strategy has edge. It’s about the quality of the trades, not just the frequency."

— Thorsten Meyer

Limitations of Current Data and Future Validation

The main uncertainty is whether the promising strategy will maintain its edge over a larger number of trades. The current sample size—several hundred trades—is insufficient to confidently confirm persistent profitability. Variance and market regime changes could easily distort the results as more data accumulates.

Additionally, the experiment's reliance on simulated data means real-world trading might produce different outcomes, especially considering factors like slippage, transaction costs, and market impact, which are not fully modeled here.

Next Steps for Confirming Strategy Viability

Research will continue with significantly more trades—by at least an order of magnitude—to test whether the identified strategy can sustain profitability. Further, the researcher plans to explore different market conditions and assets to evaluate the robustness of the approach.

Meanwhile, efforts will be made to refine the models and understand the underlying features that contribute to the observed edge. Results from these extended tests will inform whether the strategy warrants further development or remains a statistical anomaly.

Key Questions

Does a high win rate guarantee profitability?

No. A high win rate can be misleading if the wins are small and losses are large. Genuine edge depends on asymmetric payoffs and market understanding, not just frequency of wins.

Why is market-implied probability important in evaluating strategies?

Because it provides a realistic baseline for assessing whether a strategy truly has an advantage, rather than relying on naive assumptions like a 50% chance for all trades.

Can a strategy with less than 50% win rate still be profitable?

Yes. If its average wins are significantly larger than its losses, it can generate positive returns despite losing more often than winning.

What are the risks of relying on simulated trading experiments?

Simulations may not capture all real-world factors like slippage, transaction costs, and market impact, so results might not translate directly to live trading.

Source: ThorstenMeyerAI.com

You May Also Like

When-to-replace planner for data center equipment

A new SaaS tool aims to help data center managers decide optimal hardware replacement timing, improving efficiency and reducing costs.

PEMF Therapy Explained Without the Woo: What the Field Is Doing

Discover the scientific principles behind PEMF therapy and how it genuinely promotes healing—what the field is truly accomplishing might surprise you.

Every Benchmark Launched 2023-2024 Has Fallen — The METR / SWE-Bench / CORE-Bench / MLE-Bench / PostTrainBench Sequence

Every major AI research benchmark launched in 2023-2024 has reached saturation or is nearing it, indicating rapid progress and potential limits.

Mistral. The fourth path.

Mistral raises $830M, becomes Europe’s leading single-firm AI player, but still trails US models in reasoning capabilities amid ongoing strategic debates.